
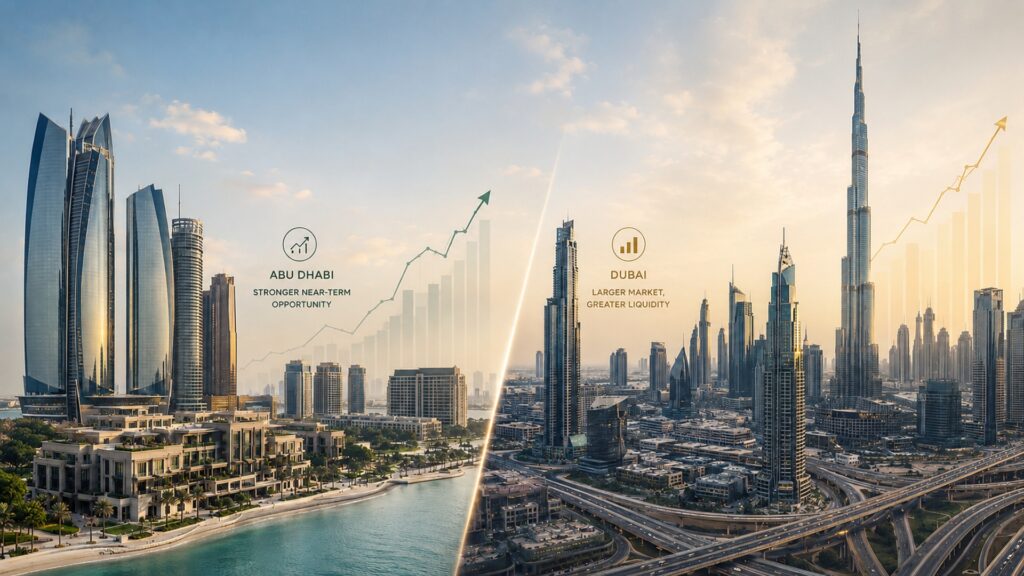
The question every UAE property investor is asking in 2026 is not simply which emirate is performing better. It is which market is better suited to their specific investment goals, their risk appetite, and their time horizon. Dubai and Abu Dhabi are the UAE’s two most active residential property markets, and they are performing well simultaneously, but in meaningfully different ways. Getting this comparison wrong is expensive. Getting it right is one of the most important investment decisions available in the current global real estate landscape.
This article presents every major comparable metric across both markets using the most current validated data available, with an honest assessment of where each emirate leads and where it trails. The conclusion will be clear. But the comparison deserves to be made with precision.
Price Per Square Foot: Abu Dhabi’s Most Surprising Lead
The data point that most surprises first-time UAE investors in 2026 is the off-plan price comparison. Dubai’s citywide average transacted price for off-plan homes stood at AED 2,030 per sqft in Q1 2026, up 12.22% year-on-year. For Abu Dhabi, the average transacted price for off-plan properties reached AED 2,191 per sqft, up 17.99% year-on-year.
Abu Dhabi’s off-plan market is now priced above Dubai’s on a per-sqft basis. That is a structural shift that reflects the sustained absorption of limited supply by strong demand. Ready homes tell a different story: Abu Dhabi ready homes average AED 1,507 per sqft, up 25.06% year-on-year, against Dubai’s AED 1,691 per sqft, up 5.62% year-on-year. The ready home premium still sits with Dubai, but Abu Dhabi is closing the gap at nearly five times Dubai’s growth rate in this segment.
| Price Metric | Abu Dhabi Q1 2026 | Dubai Q1 2026 | YoY Change |
| Off-plan average price | AED 2,191 per sqft | AED 2,030 per sqft | AD +17.99% / DXB +12.22% |
| Ready home average price | AED 1,507 per sqft | AED 1,691 per sqft | AD +25.06% / DXB +5.62% |
| Saadiyat Island apartments | AED 1,800 to AED 2,800 per sqft | N/A | Cultural district premium |
| Yas Island apartments | AED 1,200 to AED 1,800 per sqft | N/A | Entertainment discount |
| Abu Dhabi premium vs equivalent Dubai mid-tier | 30% to 40% lower overall citywide | — | Value gap still exists |
The honest framing is this: Abu Dhabi’s premium island addresses now command genuine premium pricing. But the emirate’s citywide average remains 30 to 40% more affordable than equivalent Dubai neighbourhoods on a per-sqft basis. That affordability gap is the entry-point advantage that yields the strongest long-term return profile.
Transaction Volume: Dubai Leads in Size, Abu Dhabi Leads in Growth Rate
Dubai delivered its strongest performance on record in 2025 with over 270,000 transactions valued at AED 917 billion. Abu Dhabi’s full-year 2025 figure was AED 142 billion across 42,814 deals, a 44% year-on-year increase. The absolute comparison favours Dubai significantly. The growth rate comparison tells a different story.
In Q1 2026, Abu Dhabi recorded approximately 7,200 residential transactions in the city alone, the second strongest quarter on record and only marginally behind Q4 2025’s peak of over 7,600. Year-on-year transaction growth reached 160.7% for total value, while Dubai’s Q1 2026 residential transactions of approximately 45,200 were up just 3.9% year-on-year.
| Transaction Metric | Abu Dhabi 2025 Full Year | Dubai 2025 Full Year |
| Total transaction value | AED 142 billion | AED 917 billion |
| YoY growth | 44% | 20% |
| Residential sales value | AED 76 billion | AED 164 billion (residential) |
| Residential YoY growth | 67% | Sustained at high base |
| Q1 2026 transaction value | AED 66 billion | ~AED 138 billion |
| Q1 2026 YoY growth | +160.7% | +31% |
Dubai’s liquidity advantage is real and should not be minimised. A market with over 270,000 annual transactions provides resale optionality that Abu Dhabi’s smaller market cannot currently match. For investors who may need to exit quickly, Dubai’s transactional depth is a genuine advantage.
Supply: The Single Most Important Differentiator in 2026
This is the data point that most definitively separates the two markets and where Abu Dhabi’s structural advantage is most pronounced. Around 120,000 units are scheduled for handover in Dubai in 2026, which will likely put pressure on prices and rents in the emirate, according to Anton Lopatin, Senior Director at Fitch Ratings. Abu Dhabi’s realistic handover range for the same year is 6,500 to 9,000 units.
That is not a marginal difference. Dubai is delivering approximately 15 to 18 times more new residential supply than Abu Dhabi in 2026. The consequences are already visible in the forecasts. Dubai price appreciation is forecast to moderate to mid-single-digit levels of 5 to 8% in 2026, a marked slowdown from the 12 to 22% annual growth recorded during 2024 and 2025. Abu Dhabi’s market conditions are likely to stay tight, supporting additional price and rental growth of 8 to 12% in 2026, as limited new supply continues to bolster both sales and leasing activity.
| Supply Metric | Abu Dhabi 2026 | Dubai 2026 |
| Projected completions | 15,900 units | 120,000+ units |
| Realistic handovers | 6,500 to 9,000 units | 77,500 to 100,000 units |
| Supply growth as % of stock | 3.3% | 8 to 10% |
| Price growth forecast 2026 | 8 to 12% | 5 to 8% |
| Supply pressure assessment | Tight, landlord market | Balanced to supply-pressured |
For investors seeking to understand which market is more likely to sustain price appreciation through 2026 and 2027, the supply data produces a clear directional answer. For guidance on positioning within Abu Dhabi’s supply-constrained environment, consulting a Trusted VIP property broker Abu Dhabi provides the district-level intelligence to identify where the supply constraint is most acute and most beneficial.
Rental Yields: Abu Dhabi Closes the Gap in 2026
Dubai has historically commanded higher rental yields than Abu Dhabi, and that advantage persists in aggregate. REIDIN’s April 2026 report estimates residential rental yields at 6.57% in Dubai and 6.08% in Abu Dhabi. However, these citywide averages conceal a more nuanced picture at the district level.
For apartments specifically, Dubai yields reach 7.08% and Abu Dhabi reaches 6.50%. For villas, Abu Dhabi actually leads at 4.75% versus Dubai’s 4.54%. On Yas Island specifically, net rental yields reached 7.5% annually in March 2026. Al Reem Island apartment yields range between 6 and 8%, competing directly with Dubai’s highest-yielding districts.
| Yield Metric | Abu Dhabi | Dubai |
| Overall residential yield | 6.08% | 6.57% |
| Apartment yield | 6.50% | 7.08% |
| Villa yield | 4.75% | 4.54% |
| Yas Island net yield | 7.50% | N/A |
| Annual service charges | 15 to 20% lower than Dubai | Baseline |
| Registration fee | 2% (DMT) | 4% (DLD) |
The registration fee difference is material for multi-property investors. On a AED 3 million property, Abu Dhabi’s 2% fee saves AED 60,000 compared to Dubai’s 4% DLD fee. Annual service charges are approximately 15 to 20% lower in Abu Dhabi. When total holding cost is factored in alongside headline yield, Abu Dhabi’s net yield advantage narrows the Dubai gap significantly.
Price Stability: Abu Dhabi’s Most Underappreciated Advantage
The historical price cycle comparison between Abu Dhabi and Dubai is the data point that risk-conscious investors weigh most carefully. Abu Dhabi experienced a price decline of roughly 25 to 35% from its 2014 peak through the 2016 to 2019 trough, driven by falling oil prices and oversupply. Dubai saw sharper swings of 40 to 50% during its 2008 to 2009 crash and a second correction of approximately 25 to 30% from 2014 to 2019. Abu Dhabi’s cycles tend to be shallower even when they follow a similar direction.
As of early 2026, Abu Dhabi’s residential property market is moderately less volatile than Dubai’s, largely because Abu Dhabi has a higher share of cash transactions providing less exposure to interest rate shocks, and a more conservative supply pipeline. In 2025, 87% of Abu Dhabi residential unit sales were cash transactions. This structural cash-buyer dominance is Abu Dhabi’s most powerful market stability mechanism. Cash markets do not panic during rate cycles. They absorb pressure without forced selling. Abu Dhabi’s market has shown steadier fundamentals, pointing to continued moderate price increases through mid-2026, buoyed by sustained demand and a more conservative supply pipeline, according to Ronan Arthur, Director at Cavendish Maxwell.
The Infrastructure Catalysts: Abu Dhabi’s 2026 to 2033 Advantage
Beyond the current market data, the pipeline of confirmed infrastructure and cultural investments arriving in Abu Dhabi over the next seven years creates a forward-looking advantage that no comparable Dubai analysis can currently replicate.
The Guggenheim Abu Dhabi opens in late 2026. Etihad Rail connected Abu Dhabi to Dubai on September 30, 2026. Sphere Abu Dhabi delivers a USD 1.7 billion entertainment venue by 2029. Disney Abu Dhabi arrives in the early 2030s. Dar al Funoon, designed by Frank Gehry, opens 2030. LIVEX 2026 brings 20,000 global institutional investors to Abu Dhabi in September. Each of these catalysts generates employment, tourism, and residential demand that directly supports property values in the communities surrounding them. Dubai’s infrastructure pipeline is substantial, but it is building on a base that is already globally established. Abu Dhabi’s pipeline is delivering the cultural and entertainment infrastructure that will complete its global positioning over the next decade. For investors with a five to ten-year horizon, Abu Dhabi’s forward-looking catalyst pipeline is where the most compelling total return opportunity currently resides. For access to the best Abu Dhabi properties, our specialist real estate advisory team maintains comprehensive coverage across all key investment zones.
The Honest Verdict: Which Market Is Better for You?
Neither market is universally superior. They serve different investment profiles with different strengths.
Abu Dhabi leads on supply constraint and price appreciation momentum. With 6,500 to 9,000 realistic handovers against 120,000 in Dubai, Abu Dhabi’s supply-demand imbalance is more structurally supportive of sustained price growth. ValuStrat’s 16% capital value growth forecast for Abu Dhabi in 2026 exceeds Dubai’s 5 to 8% forecast by a significant margin.
Abu Dhabi leads on price stability and cycle resilience. Shallower historical corrections, 87% cash buyer dominance, and conservative supply management all reduce downside risk for long-term holders.
Abu Dhabi leads on entry cost efficiency. The 2% registration fee versus Dubai’s 4%, 15 to 20% lower service charges, and citywide pricing 30 to 40% below equivalent Dubai neighbourhoods collectively mean that your capital works harder from day one in Abu Dhabi.
Dubai leads on absolute liquidity. Over 270,000 annual transactions provide resale depth that Abu Dhabi’s growing but smaller market cannot yet match. Investors who need exit flexibility within 1 to 3 years will find Dubai’s transaction velocity more accommodating.
Dubai leads on short-term rental yield. Dubai’s tourism volume and Airbnb market support short-term rental returns that Abu Dhabi’s more residential tenant base cannot currently replicate at scale in most communities.
| Investor Profile | Preferred Market | Primary Reason |
| Long-term capital appreciation | Abu Dhabi | Supply constraint, catalyst pipeline, 16% forecast |
| Income-focused, stable yield | Abu Dhabi | Lower costs, stable tenants, competitive net yield |
| Short-term trading / flipping | Dubai | Higher liquidity, faster resale cycles |
| Short-term rental income | Dubai | Tourism volume, Airbnb depth |
| Risk-averse, first-time investor | Abu Dhabi | Shallower cycles, regulatory maturity, cash market |
| Portfolio diversification | Both | Complementary risk profiles |
Conclusion: Abu Dhabi Is No Longer the Alternative. It Is the Destination.
For years, Abu Dhabi was discussed as the alternative to Dubai: quieter, more affordable, less glamorous. The 2026 data has retired that framing permanently. Abu Dhabi’s off-plan prices now exceed Dubai’s. Its price appreciation forecast for 2026 outpaces Dubai’s by 8 percentage points. Its supply constraint is structurally more favourable. Its cultural and infrastructure pipeline over the next seven years is unprecedented in the emirate’s history. And its market stability credentials, confirmed by shallower historical cycles and 87% cash buyer dominance, make it the more defensible choice for long-term capital.
It depends on the segment. Abu Dhabi’s average off-plan price of AED 2,191 per sqft in Q1 2026 now exceeds Dubai’s off-plan average of AED 2,030 per sqft, up 17.99% year-on-year. For ready homes, Dubai still leads at AED 1,691 per sqft versus Abu Dhabi’s AED 1,507 per sqft, but Abu Dhabi’s ready home prices grew 25.06% year-on-year against Dubai’s 5.62%. Citywide, Abu Dhabi remains 30 to 40% more affordable than equivalent Dubai neighbourhoods. For a personalised price comparison across specific communities, contact our abu dhabi real estate investment advisor team.
REIDIN’s April 2026 report confirms overall residential yields of 6.08% in Abu Dhabi and 6.57% in Dubai. For apartments, Dubai leads at 7.08% versus Abu Dhabi’s 6.50%. For villas, Abu Dhabi leads at 4.75% versus Dubai’s 4.54%. Yas Island delivers net yields of 7.5%. When factoring in Abu Dhabi’s 2% registration fee versus Dubai’s 4% and service charges that are 15 to 20% lower, Abu Dhabi’s net yield advantage narrows the headline gap significantly.
Abu Dhabi’s realistic handover range for 2026 is 6,500 to 9,000 units. Dubai is scheduled to deliver approximately 120,000 units in the same year. This 15 to 18-fold difference in new supply is the primary reason Abu Dhabi’s price appreciation forecast of 8 to 12% exceeds Dubai’s 5 to 8% forecast. Fitch Ratings confirmed that Dubai’s 120,000 deliveries will likely put pressure on prices and rents, while Cushman and Wakefield confirmed Abu Dhabi’s market will stay tight. For investment guidance in Abu Dhabi’s supply-constrained environment, visit our Luxury real estate investment advisor Abu Dhabi team.
Abu Dhabi is historically more stable. Over the past decade, Abu Dhabi experienced a maximum correction of 25 to 35% from its 2014 peak, while Dubai experienced corrections of 40 to 50% in 2008 to 2009 and 25 to 30% from 2014 to 2019. Abu Dhabi’s 87% cash buyer rate in 2025 provides structural insulation from interest rate shocks that Dubai’s higher mortgage-buyer share does not. For long-term, risk-conscious investors, Abu Dhabi’s shallower cycles and conservative supply management make it the more defensible choice.
Your investment profile determines the answer. Abu Dhabi is the stronger choice for long-term capital appreciation, cost efficiency, cycle resilience, and positioning ahead of a seven-year infrastructure and cultural catalyst pipeline including Etihad Rail, Guggenheim Abu Dhabi, Sphere Abu Dhabi, and Disney Abu Dhabi. Dubai is the stronger choice for resale liquidity, short-term rental income driven by tourism, and exposure to the world’s highest-volume transaction market. The most sophisticated investors in 2026 hold positions in both